From Volume to Value: Real-Time Sentiment Analysis on Polymarket with Flink SQL & LLMs
In our previous post, we detected Volume (Viral Prediction Markets). We built a pipeline that flagged markets the moment they started heating up.
The Problem: High volume doesn’t always mean organic interest. In crypto and prediction markets, 10,000 comments could be a heated debate about a geopolitical event, or it could be a bot swarm spamming “YES” to manipulate the order book. A simple counter cannot tell the difference between panic, euphoria, or spam.
To extract real “Alpha” (trading insight), we need to move beyond Quantitative metrics (how many?) and start building Qualitative metrics (what are they saying?).
In this post, we are upgrading our architecture from a “dumb” pipe that counts rows to an “intelligent” stream that reads them. We will integrate a Local Large Language Model (LLM) directly into our Flink SQL pipeline to classify market sentiment in real-time. While this doesn’t solve the bot problem entirely (yet), it gives us the semantic layer we need to start distinguishing between a “pumping” bot army and a “panicking” crowd.
Revised Recap Section
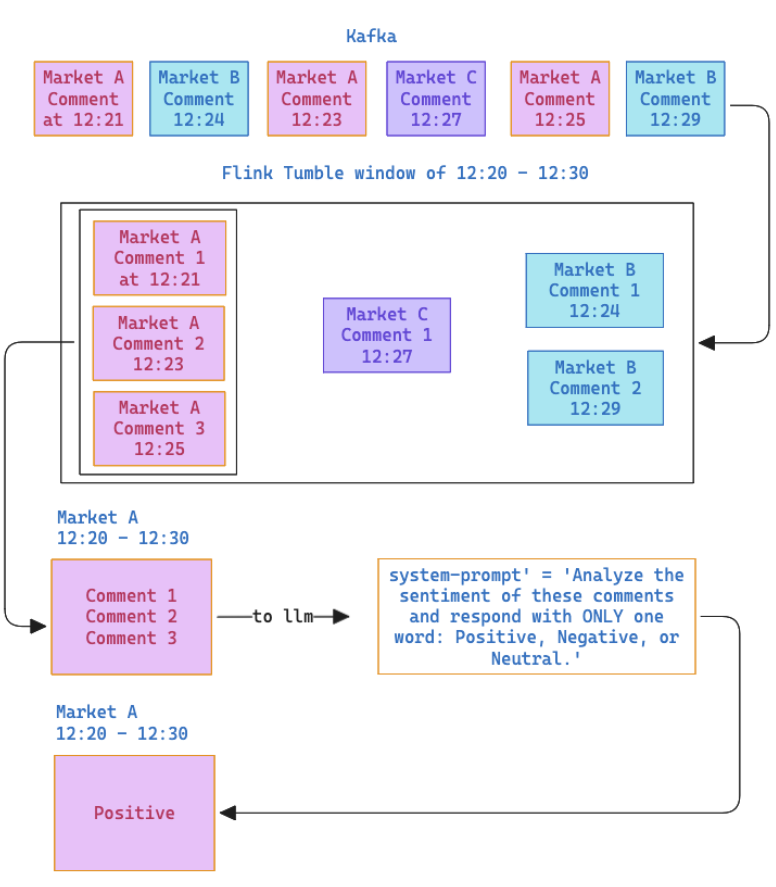
To recap the first version of the app: We built a standard streaming ETL pipeline. We ingested raw comments from the Polymarket WebSocket, buffered them in Kafka, and used a Flink tumbling window to count the messages per Market ID every 10 minutes.
The output was a histogram like the one below—useful for seeing where the crowd was, but silent on what the crowd was thinking.

In our current Grafana dashboard, we see the results of our tumbling windows: every bar represents a 10-minute block, with colors distinguishing the active markets. This gives us immediate visibility into velocity—we can instantly spot if a specific market is exploding in activity.
However, a system based purely on volume has critical blind spots. First, the definition of a ‘surge’ is currently subjective to the person staring at the screen. Second, we need to remember that volume is easily manipulated; a simple bot script could spam comments to artificially inflate a market’s ranking. Finally, the UX leaves much to be desired—tracking raw Market IDs (e.g., 28394) instead of market names makes the data hard to consume. We have established a pipeline for quantity, but we are completely missing quality. To fix this, we need to extend our architecture to extract semantic meaning (this will give us more info but will not protect us from bots yet)
Conceptually, the upgrade is straightforward even if the tech is complex. We will stick to our 10-minute windowing strategy, but we are changing the aggregation logic. Instead of reducing a window of comments to a simple integer (COUNT), we will concatenate the text and pass it into a Large Language Model (LLM). This allows us to pivot from counting rows to deriving sentiment—classifying every 10-minute block as Positive, Negative, or Neutral.
This will enrich the original chart to add the sentiments.
Technical walkthrough
I first refactored the flink code from using the Stream API to using the Flink SQL the code therefore would look from this:
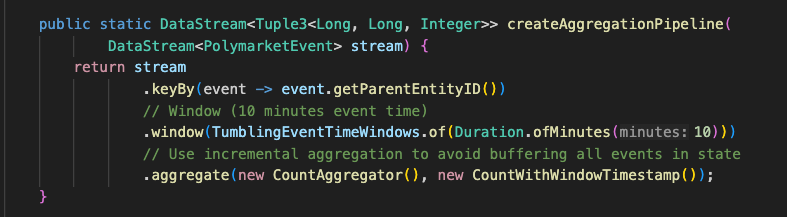
To something like this:
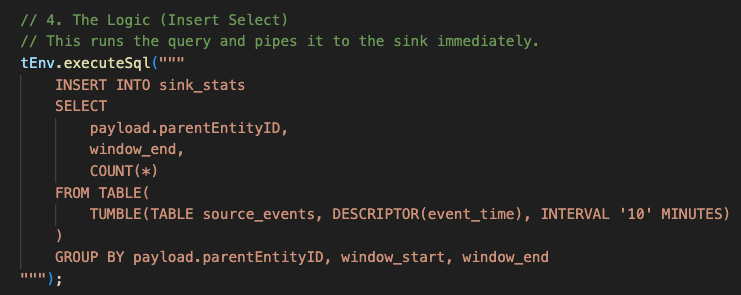
The aim is to go from verbose java to the abstracted Flink SQL which is built on top of the Table API (which in turn is an abstraction on top of the Stream API). This is essentially to see if we can represent the job in a much more intuitive way and to reduce the number of lines of code in the job and resulting code as more compact, adopting a declarative way to define the job.
The sentiment analysis parts
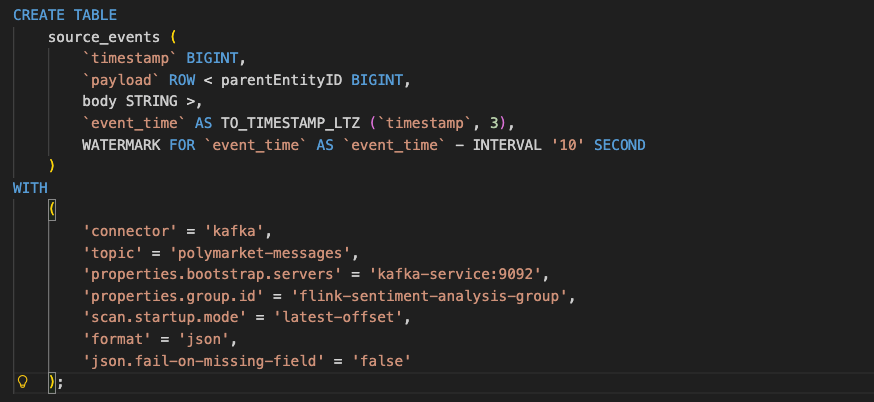
We’ll use a source connector to consume the messages from kafka with a watermarking strategy; in our case we’ll use 10 seconds (which in basic terms means that we’ll wait 10 seconds after the closing of the 10 minute window in case there is a late arrival of messages that belong in said window). This is defined in flink like this;
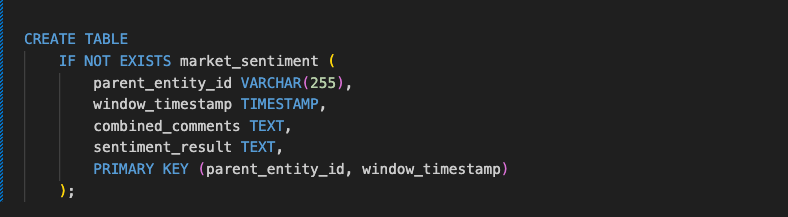
New db table to store the sentiments of the comments per market encountered in 10 minute windows, this table will be defined in our postgres helm chart.
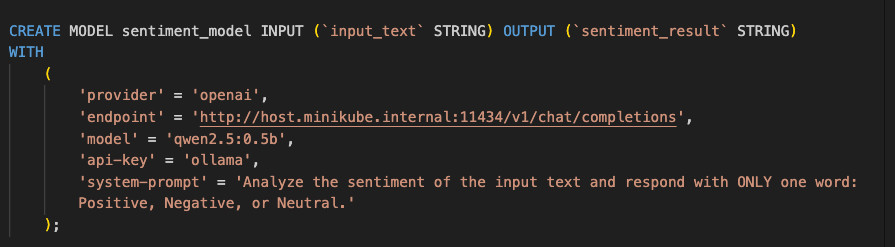
Regarding the flink model, the aim is to choose a model that i can run locally on my 32Gig Mac and the Flink model we’ll be using qwen2.5:0.5, bigger models like the 3 billion parameters and more would cook my mac as the jobs will be going over night.
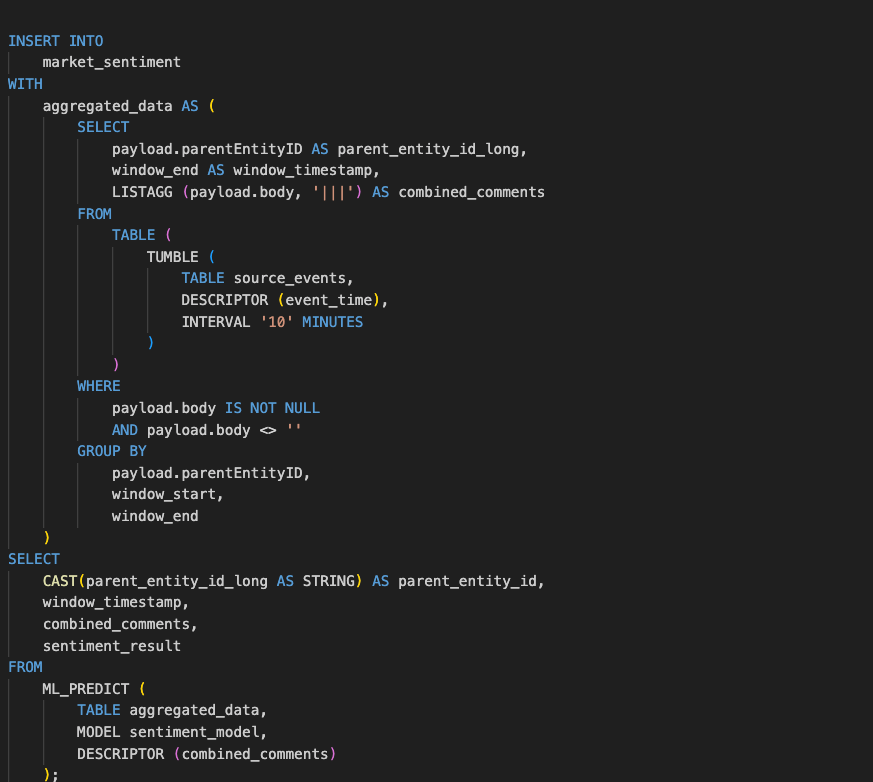
Finally, we use ML_PREDICT, a Flink SQL Table-Valued Function (TVF), to perform the actual inference. Instead of writing complex Java Async I/O code, we simply pass our aggregated_data table and the registered sentiment_model into the function. We use the DESCRIPTOR(combined_comments) to tell Flink which column contains the input features for the LLM. The function handles the interaction with the model provider (in this case, our local Ollama instance) and returns a new table containing all our original columns plus the model’s prediction, which we then cast and select for the final database insert.
Our new stacked bar chart now looks more interesting, the stacked bars represent the different markets, the height of the each bar is number of comments the market received in that 10 minute window and the colour of the bar is the sentiment
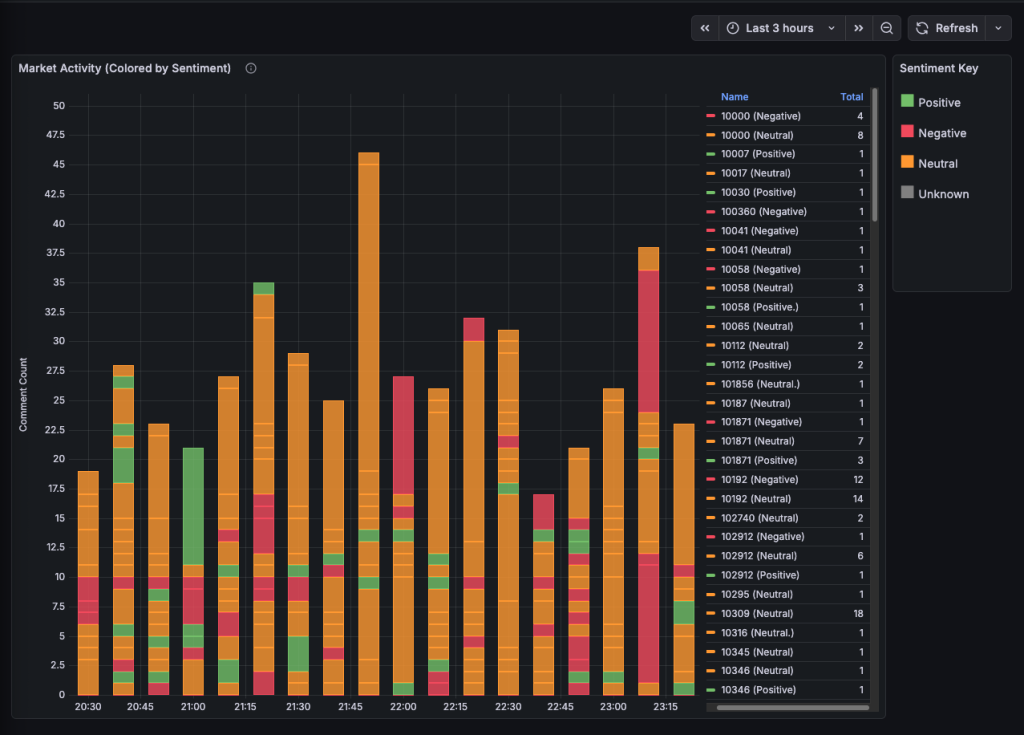
While visually superior to our first iteration, this chart exposes a critical flaw in our analytics pipeline: context collapse. Currently, we aggregate ten minutes of disjointed comments into a single prompt and ask a lightweight model (Qwen 0.5b) to summarize the vibe. The problem is that without knowing what the users are betting on and previous comments as context the model struggles to interpret vague commentary like ‘lol’ or ‘well, that’s interesting.’ When faced with ambiguity or conflicting opinions in a single batch, the model defaults to a safety rating of ‘Neutral.’ This explains the sea of yellow bars in our dashboard—technically accurate, but analytically useless. To extract real signal from this noise, we need to rethink not just our windowing strategy, but how we model the fundamental hierarchy of Polymarket data.
The Anatomy of Polymarket
The way Polymarket works isn’t just a simple “Market ID” to “Comment” relationship. It is a hierarchy that is crucial for understanding sentiment.
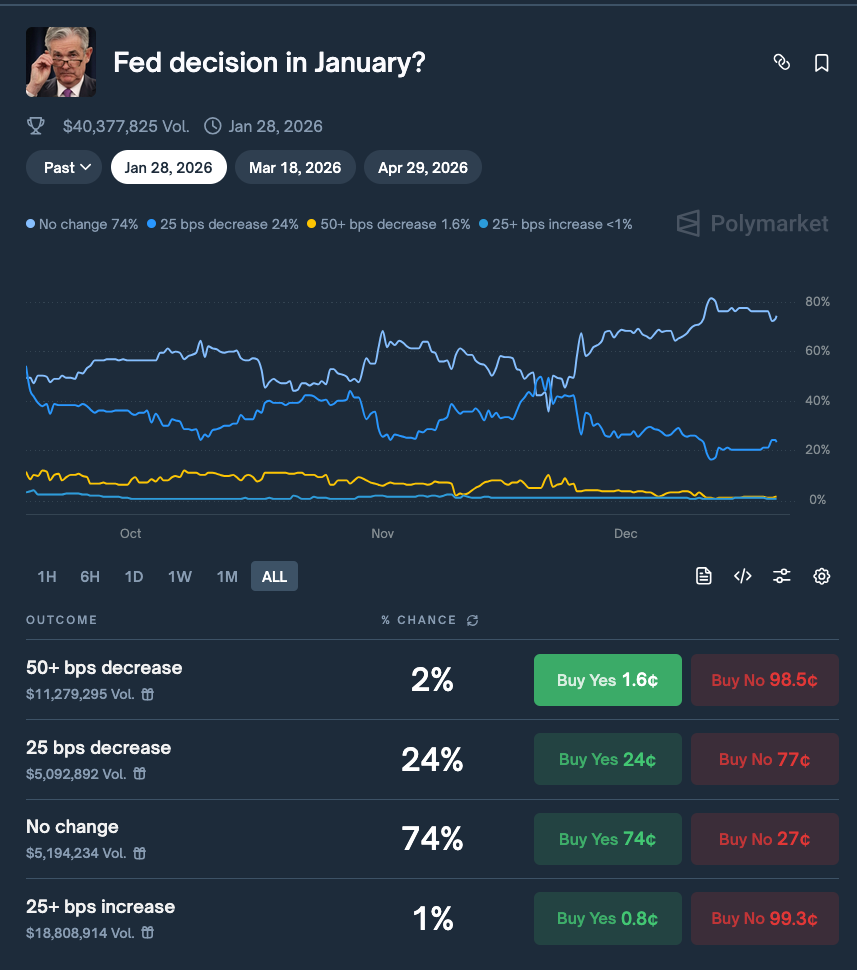
At the top level, we have an Event. This is the broad theme, for example: “Fed decision in January?” Inside that Event, there are Markets (often represented by a Question ID or Condition ID). But crucially, inside a Market, there are Outcomes (represented by Asset IDs or Token IDs).
Take the Fed example:
- Event: Fed Rate Decision in January
- Outcomes: check above image
Here lies the flaw in our current visualization.
If a user comments: “There is absolutely no way Powell cuts rates, inflation is too sticky!”
- Current System: The LLM sees “no way,” “sticky inflation,” and classifies the sentiment as Negative.
- Reality: This user is actually Bullish on Outcome #1 (“No Change”) and Bearish on Outcome #2 (“25 bps decrease”).
By flattening the data into a single “Market Sentiment,” we are losing the signal. A “Negative” sentiment on the market page might actually be a strong buy signal for the “No” token. We are currently measuring the volume of the crowd, but not which team they are cheering for.
The Missing Piece: real-time price and previous comments context
To fix this, we need to move beyond just the comments channel. According to the Polymarket CLOB API documentation, we need to cross-reference our comments with the Market Data Websocket.
Specifically, we need to ingest the price_change or last_trade_price messages.
{
  "event_type": "last_trade_price",
  "asset_id": "114122...071694",
  "market": "0x6a67...",
  "price": "0.456",
  "side": "BUY",
  "size": "219.21",
  "timestamp": "1750428146322"
}
By ingesting this stream into Flink alongside the comments, we can perform Temporal Joins. We can look at a window of 30 seconds:
- Did the price of Asset_ID_A drop?
- Did the sentiment of comments referencing Asset_ID_A turn negative?
This allows us to correlate Sentiment Velocity with Price Velocity.
Whats Next?
Our dashboard looks cool, but “Neutral” bars arent that useful. The actually 0.5b model is too small to understand nuance without help, and our aggregation strategy washes out the alpha.
In the next post, we are going to overhaul the architecture to build Smart Context:
- Ingest the Market Channel: We will add a second Kafka topic for price_change events from the Polymarket WSS.
- Outcome Mapping: We will use a lookup table (broadcast state in Flink) to map Asset IDs to human-readable names (e.g., “No Change”).
- Prompt Engineering 2.0: Instead of asking for “Sentiment,” we will ask the LLM: “Based on this comment, which Outcome is the user betting ON, and which are they betting AGAINST?”