Detecting Viral Prediction Markets in Real-Time with Apache Flink
Polymarket is generating massive amounts of user sentiment data right now. By analyzing comment velocity in real-time, we can identify which prediction markets are going viral—potentially before the price moves. In this post, we build a production-grade pipeline to spot these trends using Flink and Kafka.
Obviously, we could build this using a single Python script. But that approach falls apart when:
- You need to backfill 6 months of data. Scripts struggle with out-of-order events; Flink handles event time natively.
- The stream throughput spikes during an election night. Scripts crash; Flink scales horizontally.
- Your server dies mid-aggregation. You lose state; Flink checkpoints and resumes exactly where it left off.
So we’re building a stack that resembles a scalable, fault-tolerant production system:
- Python Websocket Client: Receives the raw comments feed from Polymarket.
- Kafka: Acts as the buffer. It takes data from the Python client and passes it downstream.
- Apache Flink: The heavy lifter. It performs real-time aggregation to calculate the number of comments per market.
- PostgreSQL: Where we store the aggregated data.
- Grafana: Used to visualize the data.
- Kubernetes (MiniKube): Ties the apps together to simulate a production environment.
All code for this project is available on GitHub
{
  "topic": "comments",
  "type": "comment_created",
  "timestamp": 1753454975808,
  "payload": {
    "body": "do you know what the term encircle means?...",
    "createdAt": "2025-07-25T14:49:35.801298Z",
    "id": "1763355",
    "parentCommentID": "1763325",
    "parentEntityID": 18396,
    "parentEntityType": "Event",
    ...
  }
}
Even though we only really care about the parentEntityID (the market) and the timestamp, we’re dumping the entire raw event into Kafka for now.
The Core: Flink Analytics
We are using Apache Flink (Java) to handle the real-time aggregation. Unlike a simple script, Flink allows us to handle stateful computations over unbounded streams.
1. Ingestion and Deserialization
We’re going to map the incoming Json directly to a Java POJO (PolymarketEvent) by configuring the KafkaSource to use a custom deserializer that uses the Jackson ObjectMapper under the hood to parse the JSON.
// 1. Configure Kafka Source with typed deserializer
KafkaSource<PolymarketEvent> source = KafkaSource.<PolymarketEvent>builder()
        .setBootstrapServers("kafka-service:9092")
        .setTopics("polymarket-messages")
        .setGroupId("flink-analytics-group")
        .setStartingOffsets(OffsetsInitializer.latest())
        .setValueOnlyDeserializer(new PolymarketEventDeserializer()) // Custom Jackson deserializer
        .build();
2. Watermarking: Dealing with Late Data
This is where Flink shines. We are using Event Time (when the comment was posted) rather than Processing Time (when our server got it). This ensures that if we re-run this job on old data, the results are exactly the same.
We also have to handle network jitter. If a comment arrives 5 seconds late, we still want it counted in the correct 10-minute bucket. We define a strategy with a 10-second tolerance:
// 2. Define Watermark Strategy
WatermarkStrategy<PolymarketEvent> watermarkStrategy = WatermarkStrategy
        .<PolymarketEvent>forBoundedOutOfOrderness(Duration.ofSeconds(10))
        .withTimestampAssigner((event, timestamp) -> event != null ? event.getTimestamp() : 0L);
Basically, we are telling Flink: “Wait up to 10 seconds for stragglers before finalizing a window.”
3. Windowing and Aggregation
Our logic is time-dependent: we want the most active markets every 10 minutes.
We define a pipeline that:
- Filters out any null/malformed events.
- Keys the stream by parentEntityID (Market ID).
- Applies a 10-minute Tumbling Event Time Window.
- Uses incremental aggregation to keep memory usage constant.
Instead of a simple .sum(), we combine an AggregateFunction with a ProcessWindowFunction. The AggregateFunction maintains a running count (state size = 1 integer regardless of event volume), while the ProcessWindowFunction captures the window’s end timestamp so we know exactly which 10-minute block the count refers to.
This incremental approach is critical for production: if a market goes viral with 100k comments in 10 minutes, we only store one integer in state—not 100k buffered events.
public static DataStream<Tuple3<Long, Long, Integer>> createAggregationPipeline(DataStream<PolymarketEvent> stream) {
    return stream
            .keyBy(event -> event.getParentEntityID())
            // Window (10 minutes event time)
            .window(TumblingEventTimeWindows.of(Duration.ofMinutes(10)))
            // Use incremental aggregation to avoid buffering all events in state
            .aggregate(new CountAggregator(), new CountWithWindowTimestamp());
}

// Incremental counter - maintains O(1) state regardless of event volume
public static class CountAggregator
        implements AggregateFunction<PolymarketEvent, Integer, Integer> {

    @Override public Integer createAccumulator() { return 0; }
    @Override public Integer add(PolymarketEvent value, Integer acc) { return acc + 1; }
    @Override public Integer getResult(Integer acc) { return acc; }
    @Override public Integer merge(Integer a, Integer b) { return a + b; }
}

// Receives pre-aggregated count and attaches window timestamp
public static class CountWithWindowTimestamp
        extends ProcessWindowFunction<Integer, Tuple3<Long, Long, Integer>, Long, TimeWindow> {

    @Override
    public void process(Long key, Context context, Iterable<Integer> counts, Collector<Tuple3<Long, Long, Integer>> out) {
        Integer count = counts.iterator().next(); // Single pre-aggregated value
        long windowEnd = context.window().getEnd();
        out.collect(Tuple3.of(key, windowEnd, count));
    }
}
4. Sinking to Postgres (Batched & Idempotent)
Writing to a database in a streaming job can kill performance if you do it row-by-row. To avoid this, we use the JdbcSink with aggressive batching. We buffer inserts until we hit 1000 records or 200ms passes.
This prevents the “thundering herd” problem where thousands of windows close at the exact same second and hammer the DB.
We also need to handle idempotency. In at-least-once or exactly-once processing, if Flink crashes and restarts from a checkpoint, it may replay the last few minutes of data. A plain INSERT would create duplicate rows. Instead, we use an upsert with Postgres’s ON CONFLICT clause—the table’s composite primary key (parent_entity_id, window_timestamp) ensures replayed writes update rather than duplicate.
aggregatedStream.addSink(JdbcSink.sink(
        "INSERT INTO market_stats (parent_entity_id, window_timestamp, count) VALUES (?, ?, ?) " +
        "ON CONFLICT (parent_entity_id, window_timestamp) DO UPDATE SET count = EXCLUDED.count",
        (statement, tuple) -> {
            statement.setString(1, String.valueOf(tuple.f0));
            statement.setTimestamp(2, new java.sql.Timestamp(tuple.f1));
            statement.setInt(3, tuple.f2);
        },
        JdbcExecutionOptions.builder()
                .withBatchSize(1000) // Batch up to 1000 inserts
                .withBatchIntervalMs(200) // Or flush every 200ms
                .withMaxRetries(5)
                .build(),
        new JdbcConnectionOptions.JdbcConnectionOptionsBuilder()
                .withUrl("jdbc:postgresql://postgres-postgresql:5432/polymarket")
                .withDriverName("org.postgresql.Driver")
                .withUsername("postgres")
                .withPassword("postgres")
                .build()));
Grafana Integration for Visualization
With the aggregated data flowing into PostgreSQL, we need a way to visualize the real-time market activity trends. Grafana provides the dashboarding layer, deployed as part of the kube-prometheus-stack Helm chart alongside Prometheus for monitoring.
Datasource Configuration
Grafana is configured with a PostgreSQL datasource that connects to our polymarket database:
# infrastructure/helm/prometheus-values.yaml
grafana:
  adminPassword: admin
  additionalDataSources:
    - name: Postgres
      type: postgres
      url: postgres-postgresql:5432
      database: polymarket
      user: postgres
      secureJsonData:
        password: postgres
      jsonData:
        sslmode: "disable"
This allows Grafana to query the market_stats table directly using SQL.
Grafana dashboard template
Rather than a separate JSON file, this project includes the dashboard inside dashboard-configmap.yaml as a ConfigMap. The dashboard-configmap.yaml contains a single configured panel titled “Polymarket Dashbaord” (a barchart) that uses a raw SQL time-series target. The panel’s query looks like this:
SELECT
  parent_entity_id,
  window_timestamp AS time,
  count
FROM market_stats
WHERE $__timeFilter(window_timestamp) AND count > 1
ORDER BY window_timestamp ASC
This query is compatible with Grafana’s time-series mode (time column) and the market_stats schema created by the Postgres init script.
Accessing Grafana locally
Port-forward Grafana and open the UI:
kubectl port-forward svc/prometheus-grafana 3000:80
# then visit http://localhost:3000 (admin/admin)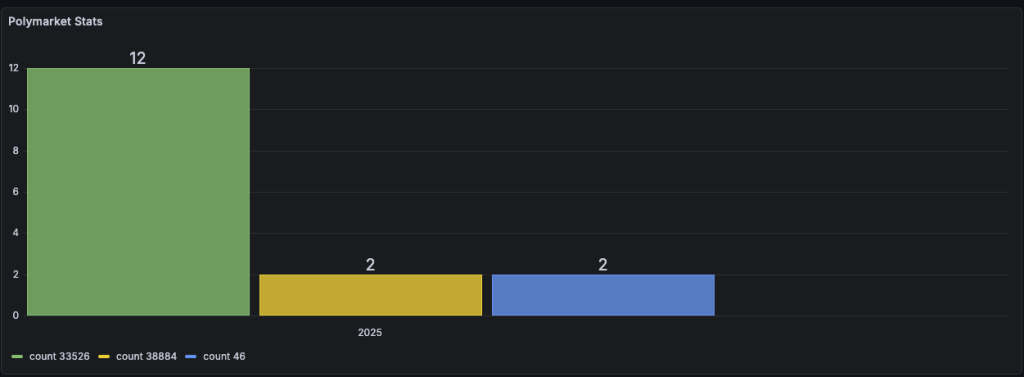
The end result, now we can see if a market gets unusually large number of comments.
Future considerations:
- Run sentiment analysis on the comments being posted for the markets.
- Use Skaffold or Tilt to setup profiles and enable better development/deployment workflow
- Enrich the graph to contain the titles of the markets and a link to take the user straight to said market.
- Set up prometheus alerts.
- Upgrade Flink to 2.1+.
- Stress test and find ways to break flink (e.g. skewed data from kafka).
- Create a realtime recommendation engine (for ecommerce usecases).